NCERT QUESTIONS
2.1: In which of the following examples of motion can the body be considered?
approximately a point object?
(a) A railway carriage moving without jerks between two stations.
(b) A cap on top of a man cycling smoothly on a circular track.
(c) A spinning cricket ball that turns sharply on hitting the ground.
(d) A tumbling beaker that has slipped off the edge of a table.
Solution:
(a), (b) The size of the railway carriage and the cap is very small as compared to the distance they’ve travelled, i.e. the distance between the two stations and the length of the race track, respectively. Therefore, the cap and the carriage can be considered as point objects.
The size of the cricket ball is comparable to the distance through which it bounces off after hitting the floor. Thus, the cricket ball cannot be treated as a point object. Likewise, the size of the beaker is comparable to the height of the table from which it drops. Thus, the beaker cannot be treated as a point object.
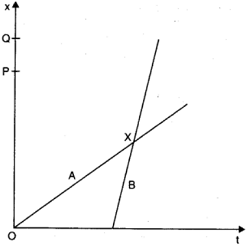
2.2: The position-time (x-t) graphs for two children, A and B, returning from their school O to their homes, P and Q, respectively, are shown in Fig. Choose the correct entries in the brackets below:
(a) (A/B) lives closer to the school than (B/A)
(b) (A/B) starts from the school earlier than (B/A)
(c) (A/B) walks faster than (B/A)
(d) A and B reach home at the (same/different) time
(e) (A/B) overtakes (B/A) on the road (once/twice).
Solution :
a. A lives closer to school than B.
b. A starts from school earlier than B.
c. B walks faster than A.
d. A and B reach home at the same time.
e. B overtakes A once on the road.
Explanation:
a. In the given x–t graph, it can be observed that distance OP < OQ. Hence, the distance of school from the A’s home is less than that from B’s home.
b. In the given graph, it can be observed that for x = 0, t = 0 for A, whereas for x = 0, t has some finite value for B. Thus, A starts his journey from school earlier than B.
c. In the given x–t graph, it can be observed that the slope of B is greater than that of A. Since the slope of the x–t graph gives the speed, a greater slope means that the speed of B is greater than the speed A.
d. It is clear from the given graph that both A and B reach their respective homes at the same time.
e. B moves later than A and his/her speed is greater than that of A. From the graph, it is clear that B overtakes A only once on the road.
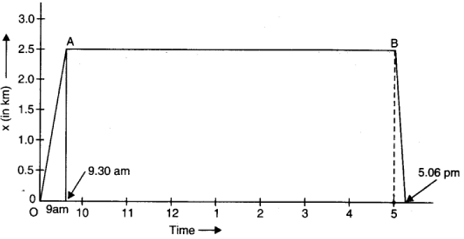
2.3: A woman starts from her home at 9.00 am, walks with a speed of 5 km h–1 on a straight road up to her office 2.5 km away, stays at the office up to 5.00 pm, and returns home by an auto with a speed of 25 km h–1. Choose suitable scales and plot the x-t graph of her motion.
Solution :
Distance covered while walking = 2.5 km.
Speed while walking = 5 km/h
Time taken to reach office while walking = (2.5/5 ) h=1/2 h
If O is regarded as the origin for both time and distance, then at t = 9.00 am, x = 0
and at t = 9.30 am, x = 2.5 km
OA is the x-t graph of the motion when the woman walks from her home to office. Her stay in the office from 9.30 am to 5.00 pm is represented, by the straight line AB in the graph.
Now, time taken to return home by an auto = 2.5/5 h =1/10 h =6 minute
So, at t = 5.06 pm, x = 0
This motion is represented by the straight line BC in the graph. While drawing the x-t graph, the scales chosen are as under:
Along time-axis, one division equals 1 hour.
Along positive-axis, one division equals 0.5 km.
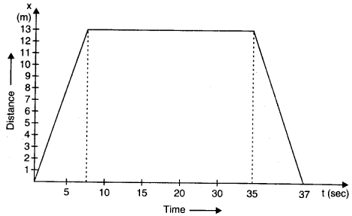
2.4: A drunkard walking in a narrow lane takes 5 steps forward and 3 steps backward, followed again by 5 steps forward and 3 steps backward, and so on. Each step is 1 m long and requires 1 s. Plot the x-t graph of his motion. Determine graphically and otherwise how long the drunkard takes to fall in a pit 13 m away from the start.
Solution :
Distance covered with 1 step = 1 m
Time taken = 1 s
Time taken to move first 5 m forward = 5 s
Time taken to move 3 m backward = 3 s
Net distance covered = 5 – 3 = 2 m
Net time taken to cover 2 m = 8 s
Drunkard covers 2 m in 8 s.
Drunkard covered 4 m in 16 s.
Drunkard covered 6 m in 24 s.
Drunkard covered 8 m in 32 s.
In the next 5 s, the drunkard will cover a distance of 5 m and a total distance of 13 m and falls into the pit.
Net time taken by the drunkard to cover 13 m = 32 + 5 = 37 s
The x-t graph of the drunkard’s motion can be shown as:
2.5: A car moving along a straight highway with a speed of 126 km h–1 is brought to a stop within a distance of 200 m. What is the retardation of the car (assumed uniform), and how long does it take for the car to stop?
Solution :
The initial velocity of the car = u
Final velocity of the car = v
Distance covered by the car before coming to rest = 200 m
Using the equation,
v = u + at
t = (v – u)/a = 11.44 sec.
Therefore, it takes 11.44 sec for the car to stop.
2.6: A player throws a ball upwards with an initial speed of 29.4 m s–1.
a. What is the direction of acceleration during the upward motion of the ball?
b. What are the velocity and acceleration of the ball at the highest point of its motion?
c. Choose the x = 0 m and t = 0 s to be the location and time of the ball at its highest point, vertically downward direction to be the positive direction of x-axis, and give the signs of position, velocity and acceleration of the ball during its upward, and downward motion.
d. To what height does the ball rise and after how long does the ball return to the player’s hands? (Take g = 9.8 m s–2 and neglect air resistance).
Solution :
(a) The acceleration due to gravity always acts downwards towards the centre of the Earth.
(b) At the highest point of its motion, the velocity of the ball will be zero, but the acceleration due to gravity will be 9.8 m/s–2 acting vertically downward.
(c) If we consider the highest point of ball motion as x = 0, t = 0, and vertically downward direction to be +ve direction of the x-axis, then
(i)During the upward motion of the ball before reaching the highest point position, x = +ve, velocity, v = -ve, and acceleration, a = +ve.
(ii) During the downward motion of the ball after reaching the highest point position, velocity and acceleration, all three quantities are positive.
(d) Initial speed of the ball, u= -29.4 m/s
The final velocity of the ball, v = 0
Acceleration = 9.8 m/s2
Applying in the equation v2 – u2 = 2gs
0 – (-29.4)2 = 2 (9.8) s
s = – 864.36/19.6 = – 44.1
Height to which the ball rises = – 44.1 m (negative sign represents upward direction)
Considering the equation of motion
v = u + at
0 = (-29.4) + 9.8t
t = 29.4/9.8 = 3 seconds
Therefore, the total time taken for the ball to return to the player’s hands is 3 +3 = 6 s.
2.7: Read each statement below carefully and state with reasons and examples, if it is true or false; A particle in one-dimensional motion
(a) with zero speed at an instant may have non-zero acceleration at that instant
(b) with zero speed may have non-zero velocity
(c) with constant speed must have zero acceleration
(d) with positive value of acceleration must be speeding up
Solution :
(a) True
(b) False
(c) True (if the particle rebounds instantly with the same speed, it implies infinite acceleration, which is unphysical)
(d) False (true only when the chosen positive direction is along the direction of motion)
2.8: A ball is dropped from a height of 90 m on a floor. At each collision with the floor, the ball loses one-tenth of its speed. Plot the speed-time graph of its motion between t = 0 to 12 s.
Solution :
Height from which the ball is dropped = 90 m
The initial velocity of the ball, u = 0
Let v be the final velocity of the ball
Using the equation
v2 – u2 = 2as ——–(1)
v12 – 0 = 2 x 10 x 90
v1= 42.43 m/s
Time taken for the first collision can be given by the equation
v = u + at
42.43 = 0 + (10) t
t1 = 4.24 s
The ball losses one-tenth of the velocity at collision. So, the rebound velocity of the ball is
v2= v – (1/10)v
v2 = (9/10) v
v2= (9/10) (42.43)
= 38.19 m/s
Time taken to reach maximum height after the first collision is
v = u + at
38.19 = 0 + (10)t2
t2 = 3.819 s
The total time taken by the ball to reach the maximum height is
T = t1 + t2
T = 4.24 + 3.819 = 8.05 s
Now the ball will travel back to the ground in the same time as it took to reach the maximum height = 3.819 s
Total time taken will be, T = 4.24 + 3.819 + 3.819 = 11.86
Velocity after the second collision
v3 = (9/10) (38.19)
v3 = 34.37 m/s
Using the above information, the speed-time graph can be plotted
2.9: Explain clearly, with examples, the distinction between:
a. magnitude of displacement (sometimes called distance) over an interval of time, and the total length of path covered by a particle over the same interval;
b. magnitude of average velocity over an interval of time, and the average speed over the same interval. [Average speed of a particle over an interval of time is defined as the total path length divided by the time interval]. Show in both (a) and (b) that the second quantity is either greater than or equal to the first.
When is the equality sign true? [For simplicity, consider one-dimensional motion only].
Solution :
Let us consider an example of a football, it is passed to player B by player A and then instantly kicked back to player A along the same path. Now, the magnitude of displacement of the ball is 0 because it has returned to its initial position. However, the total length of the path covered by the ball = AB +BA = 2AB. Hence, it is clear that the first quantity is greater than the second.
( b ) Taking the above example, let us assume that football takes t seconds to cover the total distance. Then,
The magnitude of the average velocity of the ball over time interval t = Magnitude of displacement/time interval
= 0 / t = 0.
The average speed of the ball over the same interval = total length of the path/time interval
= 2AB/t
Thus, the second quantity is greater than the first.
The above quantities are equal if the ball moves only in one direction from one player to another (considering one-dimensional motion).
2.10: A man walks on a straight road from his home to a market 2.5 km away with a speed of 5 km h –1. Finding the market closed, he instantly turns and walks back home with a speed of 7.5 km h–1. What is the
a. magnitude of average velocity, and
b. average speed of the man over the interval of time (i) 0 to 30 min, (ii) 0 to 50 min, (iii) 0 to 40 min? [Note: You will appreciate from this exercise why it is better to define average speed as total path length divided by time, and not as magnitude of average velocity. You would not like to tell the tired man on his return home that his average speed was zero!]
Solution :
Distance to the market = 2.5 km = 2500 m
Speed of the man walking to the market= 5 km/h = 5 x (5/18) = 1.388 m/s
Speed of the man walking when he returns back home = 7.5 km/h = 7.5 x (5/18) = 2.08 m/s
(a) Magnitude of the average speed is zero since the displacement is zero
(b)
(i) Time taken to reach the market = Distance/Speed = 2500/1.388 = 1800 seconds = 30 minutes
So, the average speed over 0 to 30 minutes is 5 km/h or 1.388 m/s
(ii) Time taken to reach back home = Distance/Speed = 2500/2.08 = 1200 seconds = 20 minutes
So, the average speed is
Average Speed over a interval of 50 minutes= distance covered/time taken = (2500 + 2500)/3000 = 5000/3000 = 5/3 = 1.66 m/s
= 6 km/h
(ii) Average speed over an interval of 0 – 40 minutes = distance covered/ time taken = (2500+ 1250)/2400 = 1.5625 seconds = 5.6 km/h
2.11: We have carefully distinguished between average speed and the magnitude of average velocity. No such distinction is necessary when we consider the instantaneous speed and the magnitude of velocity. The instantaneous speed is always equal to the magnitude of instantaneous velocity. Why?
Solution :
Instantaneous velocity and instantaneous speed are equal for a small interval of time because the magnitude of the displacement is effectively equal to the distance travelled by the particle.
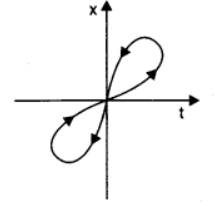
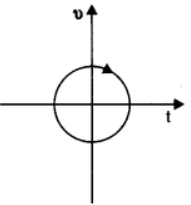
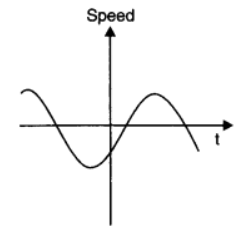
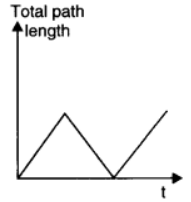
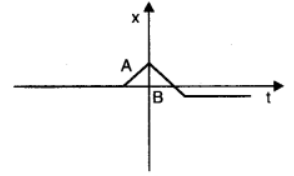
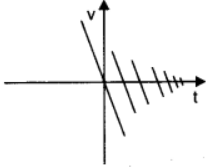
2.12: Look at the graphs (a) to (d) carefully and state, with reasons, which of these cannot possibly represent one-dimensional motion of a particle.
a.
b.
c.
d.
Solution :
a. The given x-t graph, shown in (a), does not represent one-dimensional motion of the particle. This is because a particle cannot have two positions at the same instant of time.
b. The given v-t graph, shown in (b), does not represent one-dimensional motion of the particle. This is because a particle can never have two values of velocity at the same instant of time.
c. The given v-t graph, shown in (c), does not represent one-dimensional motion of the particle. This is because speed being a scalar quantity cannot be negative.
d. The given v-t graph, shown in (d), does not represent one-dimensional motion of the particle. This is because the total path length travelled by the particle cannot decrease with time.
2.13: Figure shows the x-t plot of one-dimensional motion of a particle. Is it correct to say from the graph that the particle moves in a straight line for t < 0 and on a parabolic path for t > 0? If not, suggest a suitable physical context for this graph.
Solution :
It is not correct to say that the particle moves in a straight line for t < 0 (i.e., -ve) and on a parabolic path for t > 0 (i.e., + ve) because the x-t graph does not represent the path of the particle.
A suitable physical context for the graph can be the particle is dropped from the top of a tower at t =0.
2.14: A police van moving on a highway with a speed of 30 km h–1 fires a bullet at a thief’s car speeding away in the same direction with a speed of 192 km h–1. If the muzzle speed of the bullet is 150 m s–1, with what speed does the bullet hit the thief’s car? (Note: Obtain that speed which is relevant for damaging the thief’s car).
Solution :
Speed of the police van = 30 km/h = 30 x (5/18) = 25/3 m/s
Speed of a thief’s car = 192 km/h = 192 x (5/18) = 160/3 m/s
Muzzle Speed of the bullet = 150 m/s
Speed of the bullet = speed of the police van + muzzle speed of the bullet
= (25/3)+ 150 = 475/3 m/s
The relative velocity of the bullet w.r.t. the thief’s car is
v = Speed of the bullet – Speed of a thief’s car
= (475/3) – (160/3) = 105 m/s
The bullet hits the thief’s car at a speed of 105 m/s.
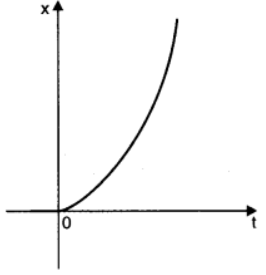
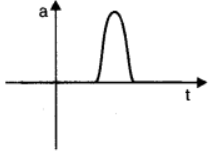
2.15: Suggest a suitable physical situation for each of the following graphs:
a.
b.
c.
Solution :
a. The given x-t graph shows that initially a body was at rest. Then, its velocity increases with time and attains an instantaneous constant value. The velocity then reduces to zero with an increase in time. Then, its velocity increases with time in the opposite direction and acquires a constant value. A similar physical situation arises when a football (initially kept at rest) is kicked and gets rebound from a rigid wall so that its speed gets reduced. Then, it passes from the player who has kicked it and ultimately gets stopped after sometime.
b. In the given v-tgraph, the sign of velocity changes and its magnitude decreases with a passage of time. A similar situation arises when a ball is dropped on the hard floor from a height. It strikes the floor with some velocity and upon rebound, its velocity decreases by a factor. This continues till the velocity of the ball eventually becomes zero.
c. The given a-t graph reveals that initially the body is moving with a certain uniform velocity. Its acceleration increases for a short interval of time, which again drops to zero. This indicates that the body again starts moving with the same constant velocity. A similar physical situation arises when a hammer moving with a uniform velocity strikes a nail.
2.16: Figure gives the x-t plot of a particle executing one-dimensional simple harmonic motion. (You will learn about this motion in more detail in Chapter14). Give the signs of position, velocity and acceleration variables of the particle at t = 0.3 s, 1.2 s, – 1.2 s.
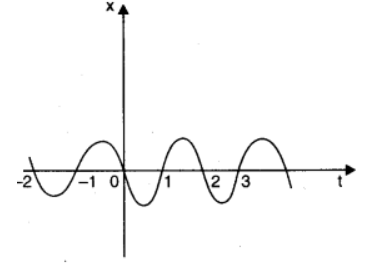
In S.H.M., acceleration, a = – ω2 x , ω is the angular frequency —-(1)
(i) At t = 0.3 s, x < 0, i.e. position is negative. Moreover, as x becomes more negative with time, it shows that velocity is negative (i.e., v < 0). However, using equation (1), acceleration will be positive.
(ii) At t = 1.2 s, In this time interval, x is positive. Thus, the slope of the x-t plot will also be positive. Therefore, both position and velocity are positive. However, using equation (i), acceleration of the particle comes to be negative.
(iii) At t = -1.2 s, In this time interval, x is negative. Thus, the slope of the x-t plot will also be negative. Since both x and t are negative, the velocity comes to be positive. From equation (i), it can be inferred that the acceleration of the particle will be positive.
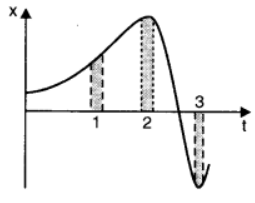
2.17: Figure gives the x-t plot of a particle in one-dimensional motion. Three different equal intervals of time are shown. In which interval is the average speed greatest, and in which is it the least? Give the sign of average velocity for each interval.
Solution :
Interval 3 is the greatest, and 2 is the least. The average velocity is positive for intervals 1 and 2, and it is negative for interval 3.
The average speed of a particle shown in the x-t graph is obtained from the slope of the graph in a particular interval of time.
It is clear from the graph that the slope is maximum and minimum restively in intervals 3 and 2 respectively. Therefore, the average speed of the particle is the greatest in interval 3 and is the least in interval 2. The sign of average velocity is positive in both intervals 1 and 2 as the slope is positive in these intervals. However, it is negative in interval 3 because the slope is negative in this interval.
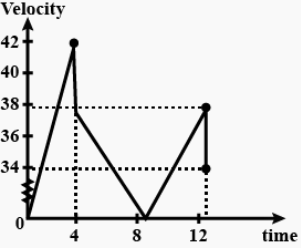
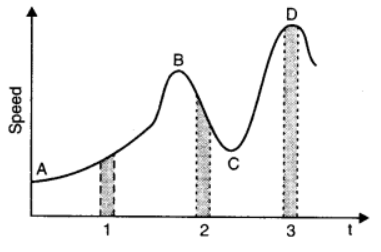
2.18: Figure gives a speed-time graph of a particle in motion along a constant direction. Three equal intervals of time are shown. In which interval is the average acceleration greatest in magnitude? In which interval is the average speed greatest? Choosing the positive direction as the constant direction of motion, give the signs of v and a in the three intervals. What are the accelerations at the points A, B, C and D?
Solution :
Average acceleration is greatest in interval 2
Average speed is greatest in interval 3
v is positive in intervals 1, 2, and 3
a is positive in intervals 1 and 3 and negative in interval 2
a = 0 at A, B, C, D
Acceleration is given by the slope of the speed-time graph. In the given case, it is given by the slope of the speed-time graph within the given interval of time.
Since the slope of the given speed-time graph is maximum in interval 2, average acceleration will be the greatest in this interval.
Height of the curve from the time-axis gives the average speed of the particle. It is clear that the height is the greatest in interval 3. Hence, average speed of the particle is the greatest in interval 3.
In interval 1:
The slope of the speed-time graph is positive. Hence, acceleration is positive. Similarly, the speed of the particle is positive in this interval.
In interval 2:
The slope of the speed-time graph is negative. Hence, acceleration is negative in this interval. However, speed is positive because it is a scalar quantity.
In interval 3:
The slope of the speed-time graph is zero. Hence, acceleration is zero in this interval. However, here the particle acquires some uniform speed. It is positive in this interval.
Points A, B, C, and D are all parallel to the time-axis. Hence, the slope is zero at these points. Therefore, at points A, B, C, and D, acceleration of the particle is zero.